Introduction
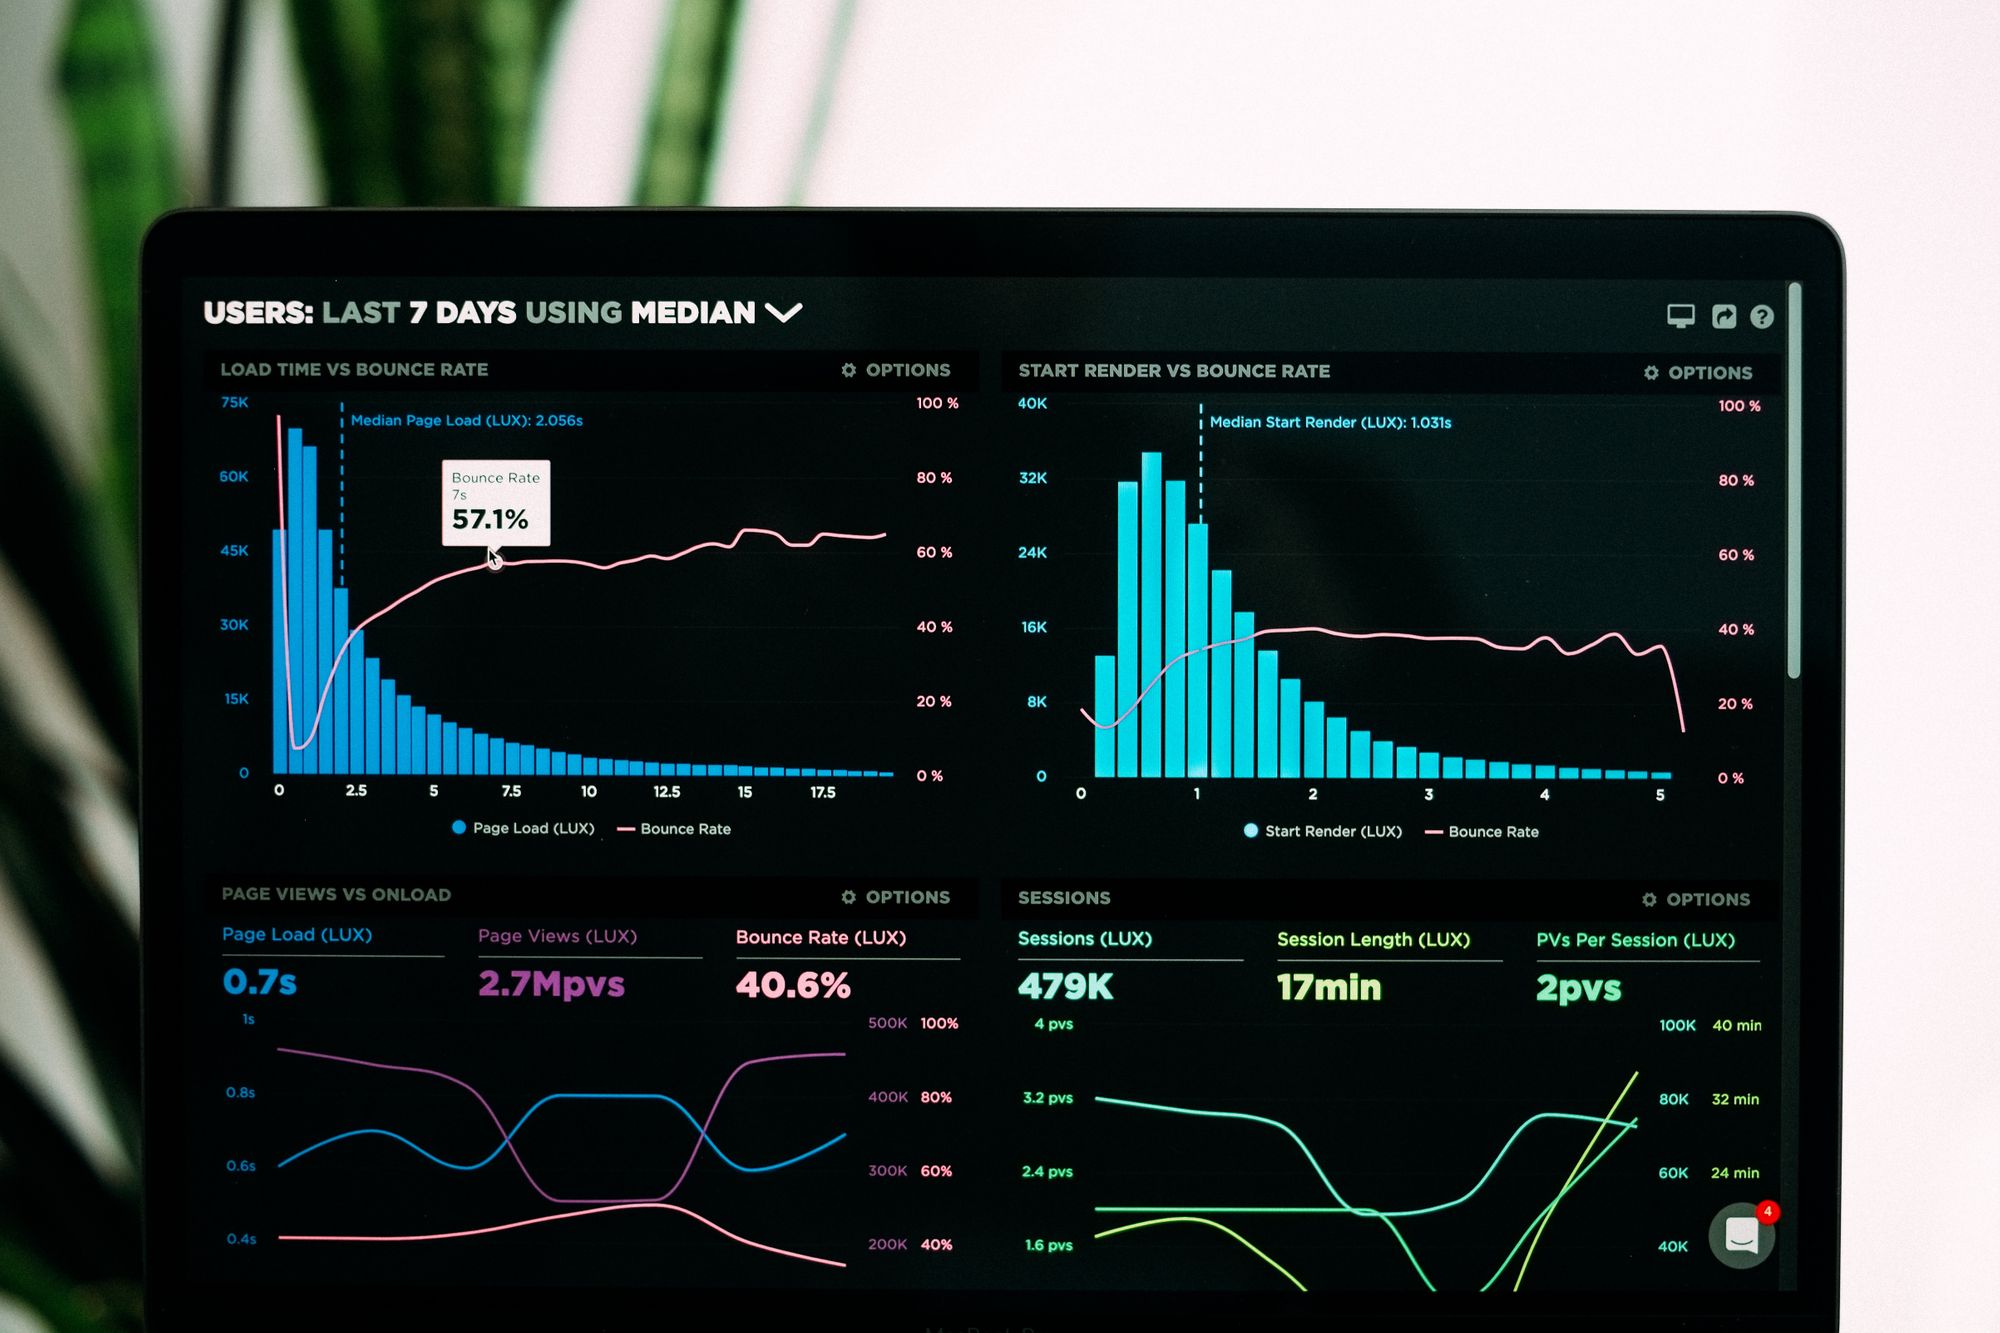
In the digital age, data visualization has emerged as a cornerstone for understanding vast amounts of information. The right visualization can transform abstract numbers into insightful stories. But with a plethora of libraries available, which one should you choose? Dive into our detailed guide on the top 7 data visualization libraries to make an informed decision.
Table of Contents
Matplotlib (Python)
When we talk about Python and data visualization, Matplotlib is often the first name that springs to mind. Established as the foundational plotting library for Python, Matplotlib offers a broad spectrum of plotting options. From basic bar charts to intricate 3D visualizations, this library has got you covered.
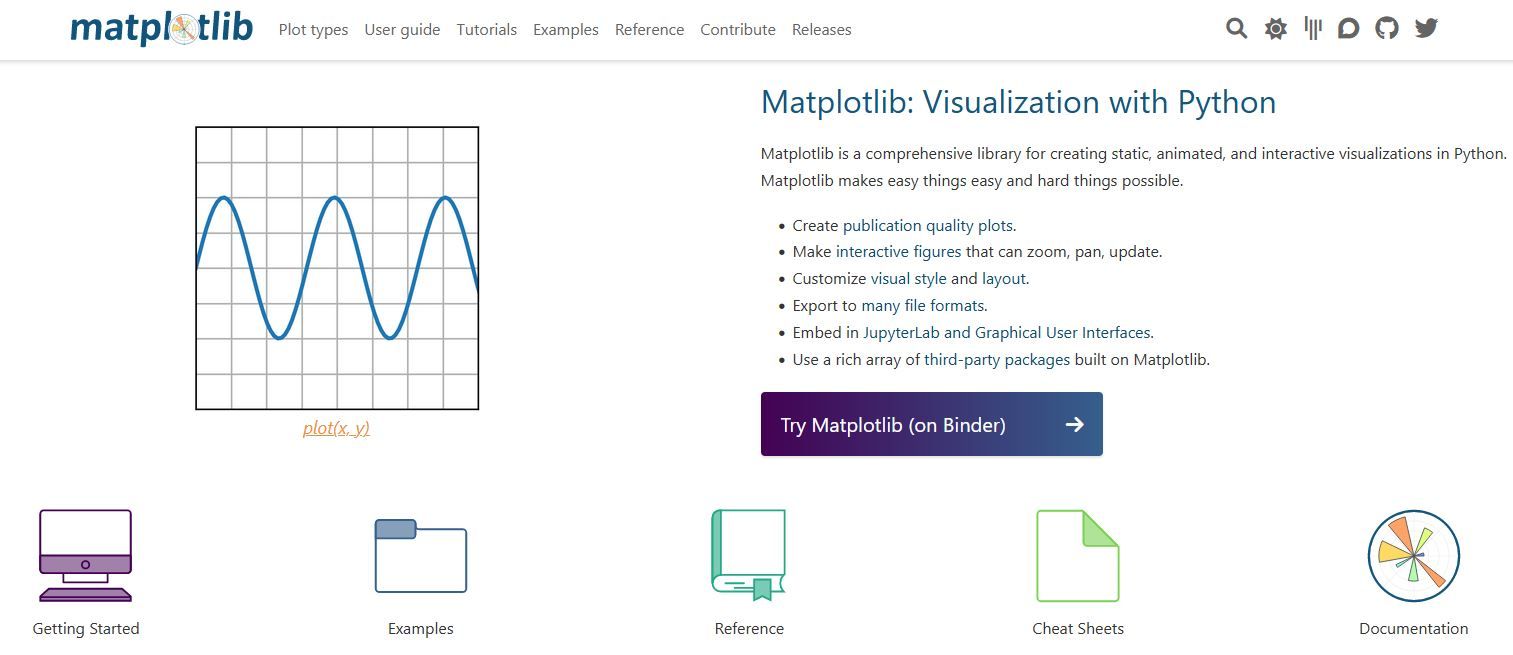
Source: Matplotlib
However, while its versatility is a boon for seasoned developers, beginners might find the initial learning curve a tad steep. And though its default visuals serve their purpose, a touch of customization is often needed to make them more contemporary.
import matplotlib.pyplot as plt
x = [1, 2, 3, 4, 5]
y = [1, 4, 9, 16, 25]
plt.plot(x, y)
plt.title('Simple Line Plot')
plt.xlabel('X-axis')
plt.ylabel('Y-axis')
plt.show()
Pros:
- Highly customizable.
- Versatile plotting options.
- Robust community support.
Cons:
- Can be overwhelming for beginners.
- Default visuals might appear outdated.
Looking to challenge your Python skills further? Dive into our list of advanced Python project ideas, perfect for honing your web scraping expertise.
Explore them now at Top Web Scraping Python Projects Ideas on DataHen’s blog.
Seaborn (Python)
Imagine taking the robust foundation of Matplotlib and draping it with an elegant interface and stunning default themes. That's Seaborn for you. Built atop Matplotlib, Seaborn simplifies the process of crafting complex visualizations. Its integration with the popular data manipulation library, pandas, is the cherry on top.
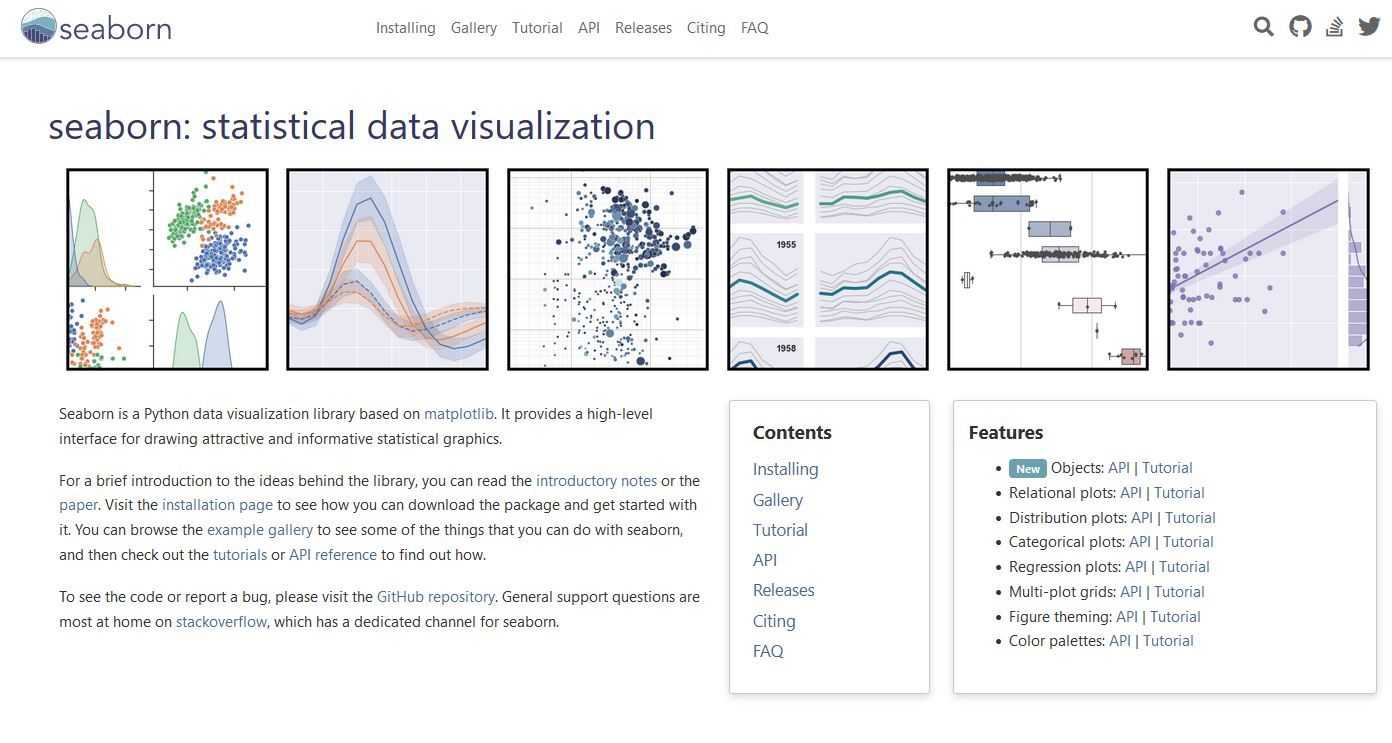
Source: seaborn
But it's worth noting that while Seaborn offers a plethora of features, for advanced customizations, a good grasp of its parent library, Matplotlib, is essential.
import seaborn as sns
tips = sns.load_dataset('tips')
sns.boxplot(x='day', y='total_bill', data=tips)
plt.title('Boxplot of Total Bill by Day')
plt.show()
Pros:
- Simplifies complex visualizations.
- Beautiful default themes.
- Integrates seamlessly with pandas.
Cons:
- Less flexibility than Matplotlib for advanced customizations.
- Relies on Matplotlib for some functionalities.
Plotly (Python, R, Julia)
In the realm of interactive visualizations, Plotly reigns supreme. Its ability to craft dynamic plots that users can engage with sets it apart. Moreover, its support for multiple languages, including Python, R, and Julia, ensures a wide reach. Web developers would also appreciate its seamless web integration capabilities.
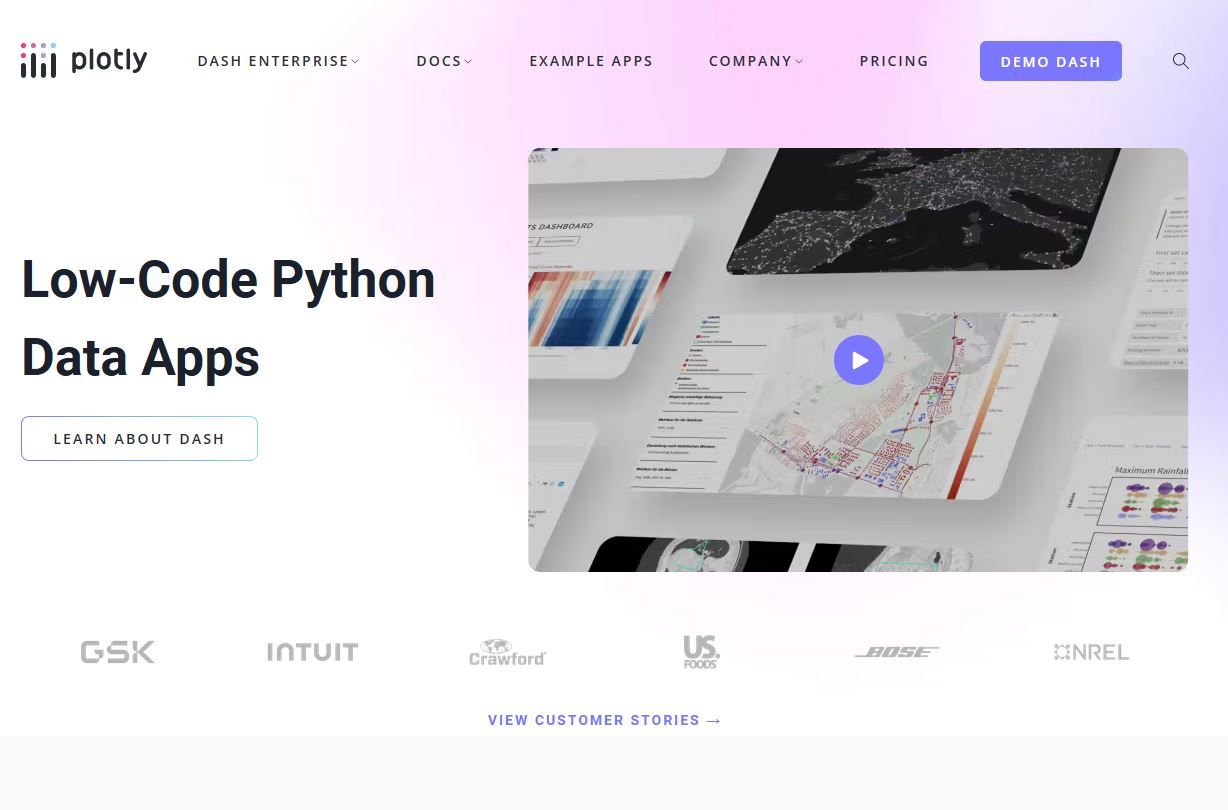
Source: plotly
However, as with all things shiny, there's a flip side. Plotly can sometimes lag with extensive datasets, and certain features might require an active internet connection.
import plotly.express as px
df = px.data.iris()
fig = px.scatter(df, x="sepal_width", y="sepal_length", color="species", size="petal_length")
fig.show()
Pros:
Creates interactive plots effortlessly.
Multi-language support.
Web integration capabilities.
Cons:
Might be slower with extensive datasets.
Some features require online connectivity.
Enjoy reading this article on Data Visualization Tools?
Then you will definitely like our article on the best python libraries for web scraping.
Read now.
D3.js (JavaScript)
For those who breathe JavaScript and seek granular control over their visualizations, D3.js is a dream come true. This library stands out for its dynamic and interactive visualizations, allowing developers to craft bespoke visuals from scratch. Its extensive documentation is a testament to its capabilities.
Source: D3.js
However, this power comes at the cost of complexity. D3.js is not for the faint-hearted and demands a solid understanding of JavaScript.
// Assuming a selection of SVG circles bound to data
d3.selectAll("circle").transition().duration(2000).attr("r", function(d) { return d.value; });
Pros:
- Unparalleled interactivity.
- Granular control over visuals.
- Extensive documentation.
Cons:
- Requires a solid grasp of JavaScript.
- Steeper learning curve than other libraries.
Vega (JavaScript)
Vega is like the younger sibling of D3.js, aiming to simplify the visualization creation process. By offering a declarative format, it streamlines the steps needed to produce stunning visuals. And while it's built on D3.js, it provides a higher-level abstraction, making it more accessible. But, as with all abstractions, there's a trade-off.
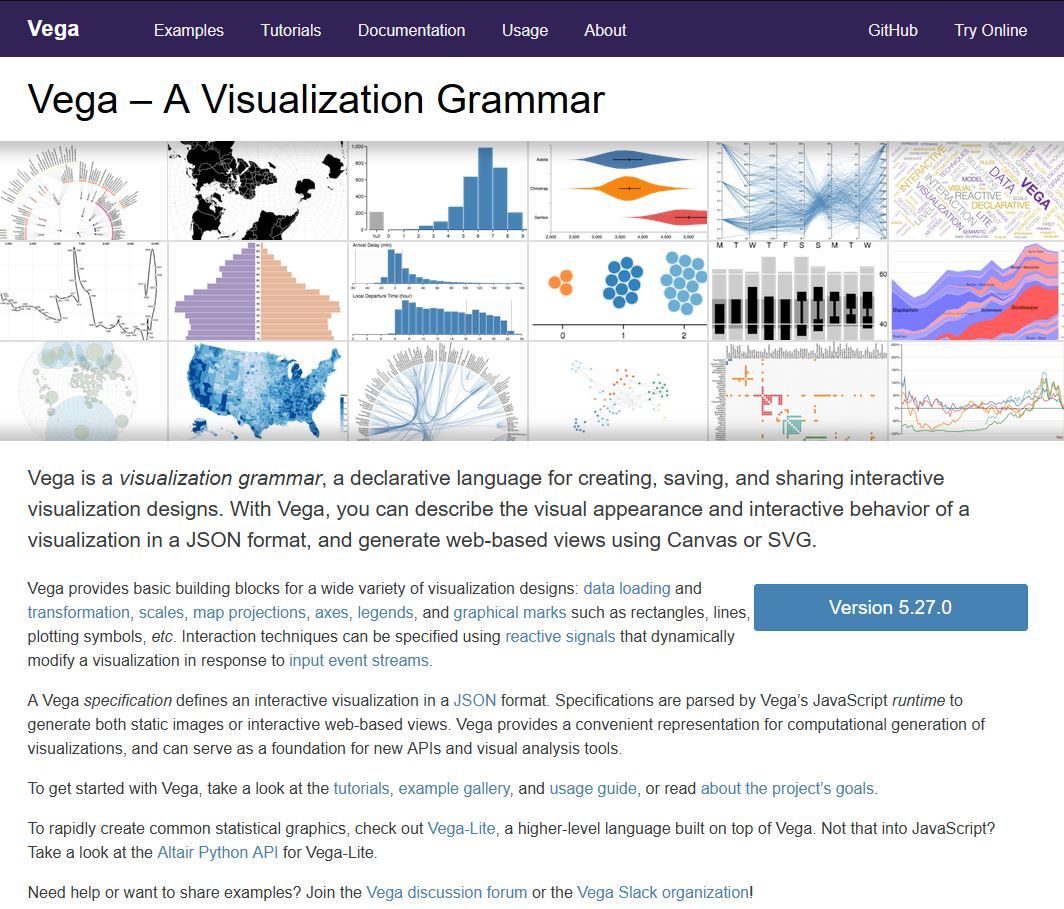
Source: Vega
Vega might not offer the same level of flexibility as D3.js, especially for those looking to craft highly customized visuals.
{
  "$schema": "https://vega.github.io/schema/vega-lite/v5.json",
  "data": {"url": "data/movies.json"},
  "mark": "bar",
  "encoding": {
    "x": {"field": "IMDB_Rating", "bin": true},
    "y": {"aggregate": "count", "type": "quantitative"}
  }
}
Pros:
- Simplified visualization creation.
- Built on D3.js.
- Logical and consistent.
Cons:
- Less flexibility compared to raw D3.js.
- Smaller community.
Dash (Python)
Web developers with a penchant for Python, rejoice! Dash enables the creation of analytical web applications using just Python, eliminating the need for JavaScript. It's like merging the best of both worlds: the simplicity of Python with the interactivity of web apps. And its integration with Plotly is the icing on the cake.
Source: dash
However, it's essential to note that Dash is more resource-intensive than standalone visualization libraries. A basic understanding of web development concepts will also come in handy.
import dash
import dash_core_components as dcc
import dash_html_components as html

app = dash.Dash(__name__)
app.layout = html.Div([
    dcc.Graph(figure=fig)  # 'fig' can be a Plotly figure object
])

if __name__ == '__main__':
    app.run_server(debug=True)
Pros:
- Web applications with Python.
- No JavaScript required.
- Integrates with Plotly.
Cons:
- More resource-intensive than standalone libraries.
- Some web development knowledge needed.
ggplot2 (R)
For the R enthusiasts out there, ggplot2 is nothing short of a revelation. Rooted in the principles of the Grammar of Graphics, it offers a consistent and logical system for visualization. Its ability to produce detailed and aesthetically pleasing visuals has garnered it a loyal following.
Source: ggplot2
However, its exclusivity to the R ecosystem might be limiting for some. And for those unfamiliar with the Grammar of Graphics, there might be an initial learning curve.
library(ggplot2)
data(mpg)
ggplot(mpg, aes(x=displ, y=hwy, color=class)) + geom_point()
Pros:
- Logical plotting system.
- Rich visualizations.
- Active community.
Cons:
- Limited to the R ecosystem.
- Initial learning curve for those new to its principles.
Conclusion
The world of data visualization is vast and varied. Whether you're a Python programmer, a JavaScript junkie, or an R enthusiast, there's a library tailored to your needs. The key is to understand your requirements, experiment with different options, and find the one that resonates with your style. After all, in the realm of data, storytelling is an art, and the right tool can make all the difference.
Learn about how DataHen can help enhance you data visualiaztion needs by providing clean structure web data. Click here to learn more.
If you liked this article, check our blog about the best python libraries for web scraping by clicking this link .